What Was Medicare Thinking? Part 2: IRFs

At the same time Medicare came out with a prospective payment system (PPS) for LTACHs (see previous post) a similar new payment system was instituted for Inpatient Rehabilitation Facilities (IRFs). Under the old payment system, TEFRA reimbursed IRFs for the cost of care for Medicare patients. The payments were based on the allowed rehabilitation costs incurred, plus a small incentive to lower those costs each year. This cost reimbursement methodology under TEFRA was abandoned in favor of the new PPS installed for 2003. As with LTACHs, there was a three year phase-in option between TEFRA and PPS, which few providers chose, because the potential for profits was obvious with the PPS system.

Under the new system, a diagnosis was assigned upon admission, but the IRF also had three days to assign scores to the patient in a variety of functional areas, such as: other related diagnoses , mobility, feeding, self care, etc. A debilitated patient with say, a severe stroke would likely have a lower functional score than would a fairly healthy patient with an amputation. A lower score and more severe diagnosis would indicate the need for a longer stay and thus a higher potential payment for the IRF.

I am simplifying for the reader. Actually, rehab has a very complex set of regulations, which include functional scoring (FIM), change in FIM score at discharge, acuity (PAI) diagnostic grouping (CMG) discharge placement, outliers, etc. all of which affect Medicare payments. Also, patients must receive three minimum hours of therapy per day.

Additionally, a minimum of 60% of all patient admissions must be in 13 specific diagnostic categories. Got it? Patient R now passes though a variety of assessment tools by which payment is determined. But the level of impairment and the score improvements are determined by the IRF. Basically, the more impaired the patient, the higher the reimbursement. All in all, a well thought out but complicated methodology, with an underlying issue. The lower the admission scoring, the better the improvement scores, and the sooner a patient is discharged, the higher the potential IRF profit for that patient.

The current Medicare PPS incentives, as in LTACH, are to discharge patients as quickly as possible. But, in LTACH, there is a floor to early discharge, because the Average Length of Stay (ALOS) for all patients must be at least 25 days. However, in the rehab PPS, there is no real floor on ALOS, once the patient has been there for the 72 hours of assessment Let’s examine the results of this ingenious new reimbursement plan.

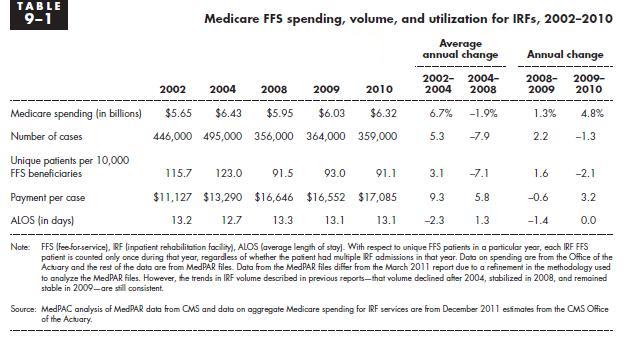
Under TEFRA in 2001, Medicare was paying $9952 per case. Under PPS, the payments ballooned to $17,085 in 2010, an increase of 72%, or over 39% in constant dollars. Not so good on cost control and saving those taxpayer dollars. This increase is magnified by the consideration that patient lengths of stay have also decreased by about 8% since PPS started. With PPS, Medicare pays more for less. Is this a good payment system?

Another unintended (perhaps) effect resulted. Under TEFRA, since Medicare was paying little more than cost, the profit margins had to come from private health insurers, who paid a higher rate than Medicare. But under PPS, the private insurers observed that since Medicare was paying out profits, the providers could be squeezed harder on the private rates. And squeezed they were. Now, many IRFs are being paid at or below costs by the private health insurers, exactly the opposite of TEFRA days!

So, the result of Medicare’s clever PPS payment plan is that taxpayers are paying for increased provider AND insurer profits. At the same time, patients are being discharged sooner. Their lengths of stay are now about 13 days, compared to 14 days in 2001 (and closer to 20 days in the mid nineties). I guess Medicare can trumpet the decreased LOS, but at what cost? I thought it was all about containing costs.

What was Medicare thinking?

medicare ffs spending

source: MEDPAC

Posted in health care costs, health care reform | Tagged , , , , , , , , | Leave a comment

What Was Medicare Thinking? Part 1: LTACH

Medicare periodically changes payment methods for healthcare providers, and the examples I’d like to present address two different post-acute services: Long Term Acute Hospitals (LTACHs, or LTACs) and Inpatient Rehabilitation Facilities (IRFs). Upon close examination of these reimbursement changes it appears that the result was increased healthcare cost for patients and taxpayers. I can only guess as to what thinking brought about these changes. In this section, I’ll focus on LTACHs.

Prior to 2002, LTACHs were reimbursed on a cost basis. (LTACHs are hospitals specifically for patients with chronic diseases or conditions, whose length of stay (LOS) is expected to be more than 25 days.) At that time, LTACHs were required to submit a year-end “cost report” which detailed the costs associated with the treatment of Medicare patients in these hospitals. The costs incurred were examined by auditors, and allowable expenditures were paid to the provider. To insure adequate cash flow to the hospital, estimated interim payments were made, and settled up after the cost report settlement. This was called the TEFRA payment system.

Then Medicare devised an LTACH “Prospective Payment System” (PPS), which would pay a fixed amount per patient stay, based on a complex formula of rating patient acuity. With PPS, the sicker or more complex the patient, the higher the payment would be. (A similar PPS already had been in place for acute hospitals for some years.)

This change led to upheaval in the LTACH business. Although an option existed to transition from cost reimbursement to PPS over several years, almost all providers immediately chose PPS. You need not wonder why. A Medicare profit was now attainable, in place of mere cost reimbursement.  Unsurprisingly, LTACH providers found that they were able to do well under the new methodology.  http://digitalcommons.library.tmc.edu/dissertations/AAI1444903/. The average Medicare profit margin rose from a pre PPS <1% to > 9% post PPS!

Under PPS, a Medicare patient admitted to an LTACH is given a diagnosis. Based on that diagnosis, a length of stay and a payment is assigned. Now, if the patient were discharged at 5/6 of that estimated LOS (don’t even ask where 5/6 came from) then the hospital would get the full payment. So if a 30-day LOS was estimated based on a certain diagnostic category, a full payment could be expected on the 25th day or after. If the patient stayed longer, no extra payment could be expected (unless they stayed a lot longer). Obviously, the incentive would be to discharge on the 25th day, and not the 30th, thereby avoiding 5 days of inpatient expenses.  Patient lengths of stay went down.

However, LTACH patients MUST have a yearly average LOS of at least 25 days, or the provider can forfeit their LTACH designation. The discharge incentive is balanced by the need to assure that in the aggregate, all patients stay that minimum amount of time. But the incentive for the earlier discharge was put in place by Medicare. Although it shortened LOS, PPS didn’t save Medicare much money, as will be shown below. It only incentivized less care to the patient, and gave tax dollars to provider profits.

Now, recall that before PPS, Medicare paid costs and arguably allowed for a small profit. At that time, most LTACH profit margins came from the private insurers. With PPS, Medicare rocketed into the position of top payer. This allowed private insurers to negotiate lower rates. For example, with PPS, a typical Medicare reimbursement was around $1400 per day, while some of the private insurer rates were as low as $950 per day. So, it appears that PPS came as a gift to both LTACH providers and private insurers, but not to taxpayers and patients.  What was Medicare thinking?

In terms of total costs, Medicare paid all LTACHs an average of $24,758 per case in 2003 (the last year of TEFRA cost payment) but $38,600 per case in 2010, an increase of 56%, or 38% when adjusted for inflation. This was coupled with shorter patient stays. A brilliant idea! Pay lots more, get less care.

If a mechanism for profit exists, then assuredly, there are the many who will seek to profit, and some that will seek to exploit it. This sort of basic behavior seemed to be overlooked by the designers of the LTACH Medicare PPS.


Posted in health care costs, health care reform, health insurance | Tagged , , , , , , , , , , | Leave a comment

Doctors and Health Care Costs: A Second Opinion

This article was written in 2012.

Let’s take a look at physicians. Less than 10% of our healthcare dollars go directly to payments to physicians. However, the total healthcare costs related to their decisions are far greater. A physician order is necessary for nearly all health services, from tests, to consulting other doctors, to hospitalization, and discharge. So they impact nearly all aspects of healthcare spending.

And of course as in virtually all aspects of American healthcare, the profit motive comes into play. In the US, if you’re a physician, people generally assume you’re wealthy. This perception is not unfounded. According to Medscape, the average 2011 physician compensation ranged from $156,000 (pediatrics) to $315,000 (orthopedics). Still, 49% of physicians believe they are underpaid!

Let’s broaden the perspective a bit. A recent McKinsey study showed that general physicians in developed countries earned double the average worker income, and specialists earned 2.7 times as much as the average worker.  In the US, primary care doctors earned 5 times as much as the average worker, with specialists earning 10 times as much. This might have something to do with the cost of a doctor visit in different places:

One possible explanation for this disparity is the number of physicians per capita in different countries. The US has about 2.4 physicians per thousand population, a third less than Europe with 3.5 per thousand. It’s not that young Americans don’t want to be doctors. It’s that the admission criteria are narrow, and the acceptance rates are small. Consequently, we are probably not turning out as many physicians as we need.

In 2009, there were 130 US medical schools. Interestingly, there were 166 medical schools in 1909, when the population was less than one third of what it was in 2009. (Citation here.)  What happened? The Flexner Report of 1910, commissioned by the AMA, reported that many “substandard” medical schools were producing “substandard” doctors. The AMA saw that the “deficient” schools were shut down.  Very few medical schools have been opened since then. This situation can at least partially explain the compensation levels of US physicians.  Keep the demand high (growing and aging population) and the supply of physicians low, and prices will increase.

The societal perception or expectation that US doctors are wealthy, and the amount of training and expense borne in medical school, can persuade some physicians that they deserve, or are expected to be wealthy. Why would any of us think differently? Who wouldn’t like to make more money doing what they’re doing? But our for-profit health system encourages the motivation for wealth.

As mentioned above, a physician order is necessary for nearly all important healthcare decisions, and herein lies a temptation. Often, the more things doctors order, the more they might be paid. For example, a CT or MRI scan can be an effective diagnostic tool. If performed, a second physician visit is generated (for discussing results) and the physician might have an actual ownership in the diagnostic clinic performing the scan.

It’s a similar situation with labs, which are routinely performed in many offices, and charged to the insurer/patient, needed or not. (I happened to know of a diagnostic clinic, where nearly 90% of the scans performed showed no injury/pathology. Just checking to be sure, I guess.)  Ownership or arrangements with labs generate additional revenue. Drugs that require regular physician monitoring are a great idea for profiting the pharmaceutical company and the doc.

It used to be that your family doctor would visit you when you were in the hospital. No more—it’s a waste of better revenue office time. Over the past decade, the new specialty of “hospitalist” has become common. This doctor only attends hospitalized patients, and since the hospitalists have no office practice, they won’t be stealing hospitalized patients from the family doctor, who’s busy in the office now. The new hospital patient gets an attending hospitalist upon admission to the hospital, who (mostly) attends throughout the stay.  The family doctor will be glad to see that patient in the office after discharge, and maybe run some tests.

A disadvantage of the hospitalist arrangement is that different physicians have different perspectives on health care costs and care, particularly when it comes to medications. I have observed family physicians puzzling over the array of meds prescribed to their discharged patients by the hospitalist, which is not exactly the ideal in coordinated care.

Another recent money making innovation has come from the hospitals, as they are now BUYING physician practices.http://online.wsj.com/article/SB10000872396390443713704577601113671007448.html This is, of course, is in the name of “efficiency”, “coordination of care”, and other platitudes of justification.

It works like this: the hospital pays a physician group a bunch of money for their practice. The docs then work for the hospital, which means they can get higher rates of reimbursement for services from insurers, as they are now “hospital-based” physicians.  On top of that, any procedures ordered will be performed at the hospital, at… can you guess? A higher insurance reimbursement!

So, a patient or insurer will pay far more for the same service and procedure from the same physician than they did several months before, when the doc wasn’t hospital-based. Everybody wins! Well, except the patient and insurer….

The latest money grab idea is the advent of a new concept in physician owned surgical hospitals. http://www.businessweek.com/articles/2012-07-19/silicon-valleys-surgeons-of-fortune

Although Medicare will no longer (as of 2011) permit physicians to refer to new hospitals in which they’re invested, the new surgery hospitals do not take Medicare patients from their surgeon investors.

They also do not join insurance networks.  Instead, they bill insurers for out of network benefits, at a rate of 5 to 25 times the in-network payment. Because of the huge insurance payment, they can afford to forgive the out-of-network penalty to the patient. Little wonder that these hospitals pay their surgeon partners rates of return that can exceed 200 percent per year!

So, it appears that the doctors will seek profit where a profit can be made, just like insurers and other providers,and most of us. That’s why the profit motive is a primary driver in healthcare costs in America, and not so much elsewhere. It’s a capitalist county, but do we believe the preservation of someone’s life and health should be related to the amount of profit they can generate?

As a footnote, I wonder what success the “Jeopardy” champion computer named Watson will have in its recent attempt to become a champion diagnostician.

http://latimesblogs.latimes.com/technology/2011/09/ibm-watson-wellpoint.html


Posted in health care costs, health care reform, health insurance | Tagged , , , , , , , | Leave a comment

A Pirate’s Life – Health Insurance Premiums Today

Long ago and far away, it seems, there was pretty much one primary health insurance provider, Blue Cross Blue Shield (BCBS).  It was originally founded in 1929, and subscribers paid $6 per year (around $80 today) for up to 21 days of hospital care. (Note: Kaiser Permanente health plan was founded around the same time, but was active mainly in California).

These organizations were specifically excluded from insurance regulation and allowed to operate as not-for-profits. They evolved over the years, taking subscriber premiums and paying out claims. They took on all subscribers without regard to pre-existing conditions, as required by their not-for-profit status. A modest profit was retained for unforeseen expenditures, and premiums were raised to cover increased costs.

The 1960s saw increasing presence from private health insurers, initially similar to the blue cross model, but as for profits, not restricted from denying coverage. These privates saw that there were two ways to make more money: increased premiums and tight claims management. So, slowly at first, and then not so slowly, the profits rolled in. As the temptation for greater profits grew, the blue cross plans were either bought up by the private insurers, or began acting like them.  Today, the for profits and not for profits are indistinguishable in their behaviors, their executive payouts, and their greed.

For example, Bruce Bodeken, CEO of Blue Shield of California, took home $4.6M last year, more than four times as much as the CEO of the largest state for-profit insurer, Anthem. Not to worry however – Anthem is owned by Indianapolis-based Wellpoint. Its CEO, Angela Braly, made $3.8M and $9M in stock awards in the same year. (Update: Agenla Braley was ousted by the Wellpoint Board this year for “dissapointing second quarter earnings”).

Remember not-for-profit Kaiser Permanente? Their head, George Halvorson, took $6.7M in total compensation and benefits. The company increased premiums in California by 9% shortly after.

In terms of sheer, audacious greed, however, the aforementioned are mere pikers. The reigning king of avarice title has to belong to William McGuire, M.D. of United Health Group In 2005, his compensation totaled $124.8M. Shocking, huh? But wait. His stock options, awarded during his eighteen-year tenure, amounted to $1.6B (that’s a “B”) which he was prepared to take when he resigned, while the company was under duress from the SEC.

Unfortunately, the SEC threw a wrench into the plan by discovering that the options were backdated. That is, the option grant dates coincided with the stock’s lowest prices for the particular periods, resulting in optimal (and illicit) gains. McGuire ended up keeping a piddling $800M or so, and United, whose Board colluded in this shady deal, had to pay some $900M in shareholder restitutions and fines.

Let me put another perspective on this unbridled avarice: assuming an annual 2006 family health insurance premium of $12,000 per year, United could have awarded McGuire $100M, and still paid the premiums for 125,000 families with the difference from what he originally planned to take. And you might throw in another 75,000 families for the $900M in penalty paybacks. Possibly, McGuire thought the phrase was “physician, heel thyself.”

United was also sued for other scams by the NY Attorney General, and the AMA resulting in a $350M combined settlement. Guess it beats paying claims.

Although United is the largest and perhaps the most avaricious health insurer, its tactics are not unique. It’s obvious where the money is going with private insurers. The AMA did a study in 2005 on how much of the premium dollar is absorbed in “administrative costs”. It found that while Medicare spent 3.1% on administration, private insurance spent 14.1%. A 2006 study by The Council on Affordable Healthcare showed a 5.2% to 16.7% difference in the same comparison.

Under the recent Obama health legislation, insurers are mandated to spend 80% on subscriber care. I would think most people would consider 20% administrative costs quite high, but in a number of states, insurers have requested waivers because the insurers are spending over 20% on administration. Have to cover those top salaries.

Is this what healthcare is or should be about? Is anyone out there happy with their health insurance? Is it time for an overhaul yet? How about a single-payer system?

Let’s look at Canada, which has a state-sponsored single-payer system. Premiums run around $100-$150 per month per family. All citizens are covered. Administrative costs are one-fifth of private insurance plans in the US. A Gallup poll indicated that while 17% of Canadians were very dissatisfied with the availability of affordable healthcare, the US figure was 44%. I’d bet that figure is higher today. Oh, and by the way, Canadians live an average of 3 years longer than we do. Nothing like getting your money’s worth, eh?

Most European countries have single-payer or heavily regulated multi-payer healthcare. Please reference the attached chart to see what different countries are paying and getting for their money. Also below, for your reference, is recent New York Times reader response to an article about a visit to Australia/New Zealand.

I might note that the World Health Organization ranked countries for the quality of their health systems in 2010. The US finished 37th, right behind Costa Rica, while France finished first. Not to be outdone, the US finished first in cost, by a wide margin.

In healthcare insurance, it seems apparent that excess is the standard for operations. But the examples of the insurance companies mentioned are nothing extraordinary today. The self-absorption and greed of these companies and organizations are examples of what’s wrong with healthcare in America.

But be assured that the health insurers are not the only ones with their hands in our pockets. More about the others to follow.

A New York Times post:

A tale of two daughters and medical care

Both daughters, one who lives in New Zealand and one who lives in USA
recently each had the exact same major female surgery. In New Zealand, terrific doctors and facilities performed successful surgery served by dedicated nurses and was kept in the hospital for four days. She never saw a bill from providers in New Zealand

In USA, second daughter had terrific doctors and facilities. In the USA our daughters’s insurance company, Aetna, said this major surgery is a day surgery according to its guidelines. Carrier denied physicians request for a single overnight surgery as its “guidelines” even before the surgery said it was not necessary. Since she lives alone, she told hospital if necessary she would pay for the overnight if doctor thought it was necessary since Aetna would not preauthorize. She was admitted for overnight following the surgery. When charges were sent to Aetna, ALL surgical charges including overnight (except surgical costs for the doctor) were denied since Aetna insisted it had only approved outpatient care. Daughter faced with thousands of dollars of charges over and above the overnight charge. We were told coding from outpatient to inpatient could not be changed. What’s wrong with this picture?

R. Ogden
SANTA FE
March 28, 2012 at 11:43 a.m.

Graph from Mary Meeker of KPCB

Posted in health care reform, health insurance | Tagged , , , , , , | Leave a comment

Introduction to Noprofithealthcare – The Health Care Blog

First, the basis for this commentary: It stems from a personal belief that health care should be a basic and readily-obtainable protection for all the citizens of a prosperous country, like defense from foreign invaders, from crime, from fire, etc. Not that this protection from illness and mortality can be provided without cost to the society or individual–we pay for all of the aforementioned protections.

I’ve been involved in health care more than 30 years, over 20 of them as a hospital CEO, mostly in for-profit companies. What I’ve observed firsthand is what engendered my thinking about the costs of services. I’ve seen what’s provided, and who profited (including me). As a for-profit CEO, I was directly involved with a number of changes, and have witnessed the pronounced cost increases over the years.

It’s well known that health care costs have risen dramatically over the past decades. In America, they’ve tripled in the past 30 years, and also doubled as a percent of GDP over the same period.

There are a number of reasons commonly given for the current situation, which I plan to detail within this website, but it is my opinion that a sizable portion of the increases can be ascribed to expanded PROFITING by health care insurance, services and products, hence the name of this domain.

As late as the 1970s, health services were almost completely in the realm of not-for-profit (NFP) organizations and institutions. These were on a mission to help people out of a sense of purpose, rather than pure financial gain. However, once health care organizations caught the scent of money, greed took over. Sound familiar? Even the not-for-profits have climbed on the gravy train. For example, a Dallas NFP paid their CEO well over $5M in annual compensation. A California NFP CEO collected nearly $7.5M in 2008. I had thought that a 501-(c)(3) organization could lose tax-exempt status for a number of reasons, including overly compensating individuals within. If correct, I wonder what happened to the enforcement of those standards?

Future essays will attempt to show how profits have contributed greatly to the mushrooming of health care costs, and how it came to be that consumers, government and non-health care businesses have shouldered the brunt of the increases.

The problem has multiple participants: insurers, pharmaceuticals, hospitals, other providers, physicians and the government (including Medicare). All have intensified the cost/profit problem, helping us to sink deeper in the bog of (hopefully) unintended consequences.

In general, people can behave predictably in certain circumstances, particularly when confronted by powerful reinforcers, like money. If there is an obvious way to make money, it will be exploited, and greed being what it is, sometimes over-exploited, to the detriment of the society.

When the health care profit door was opened, the lines formed quickly. Reversing this trend will take considerable effort, but the choices seem limited, as the more money you acquire, the more you can influence the relevant political processes.

Posted in health care reform, health insurance | Tagged , , , , , | 2 Comments